The phases of planets
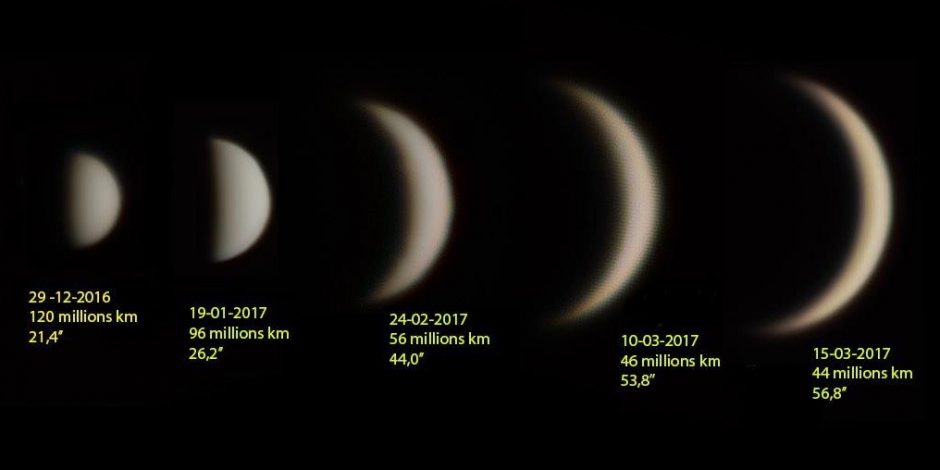
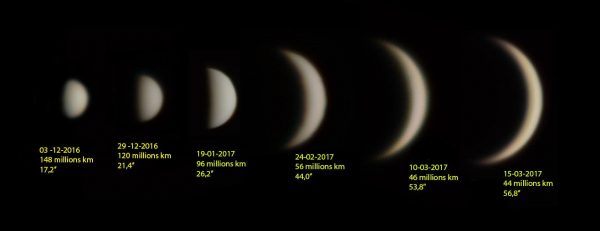
Pictures of Venus from the Earth between December 2016 and March 2017. (Credit: Serge Brunier)
On Saturday 25th of March 2017, Venus is at new phase and at the same time closest to the Earth, at 42 millions of kilometres (110 times the average Earth-Moon distance). This event is a good opportunity to talk about the phases of planets, including exoplanets, and to see what information they can teach us.
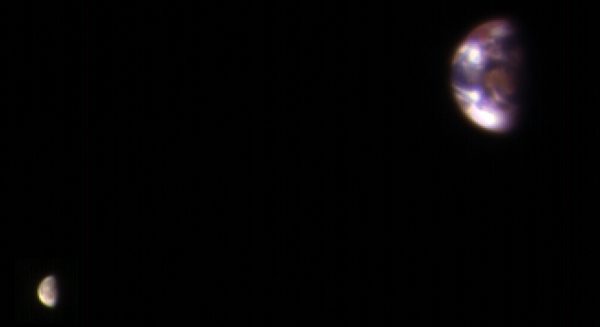
The Earth and the Moon as seen from Mars by MRO’s HiRISE camera on November 20, 2016. (Credit: NASA/JPL-Caltech/Univ. of Arizona)
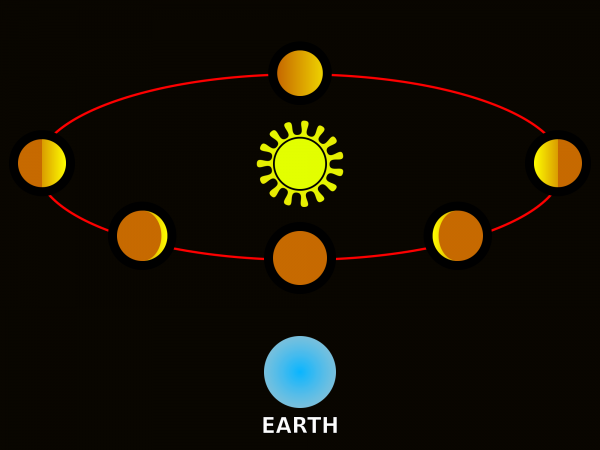
Relative position of the Earth (blue), the inferior planet / exoplanet (brown) and the Sun / star (yellow, at the center) for the different observed phases. (Credit: Nichalp)
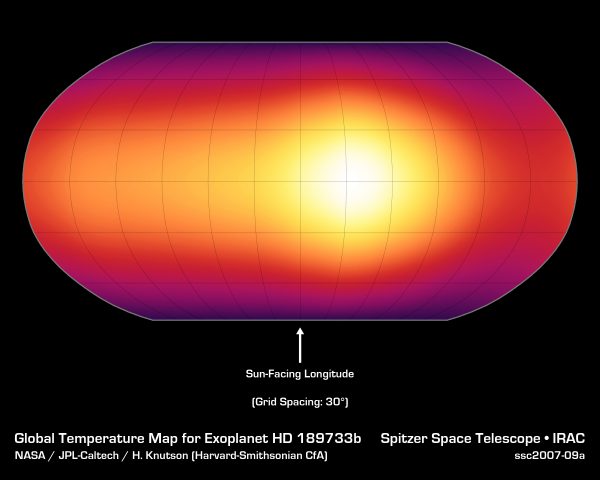
Thermal map of HD 189733 b (2007). (Credit: NASA/JPL-Caltech/H. Knutson (Harvard-Smithsonian CfA))
In the Solar System
As the Moon, inferior objects (i.e. object closer to the Sun than the Earth, including planets Mercury and Venus) show different phases when you look at them in the sky. The duration between two consecutive identical phases, called the synodic period, depends on both the period of revolution of the Earth and the one of the observed object. This period is 29.53 day for the Moon, 115.88 days for Mercury and 583.92 days for Venus.
The different phases are simply due to the relative positions of the observer, the illuminating object (the Sun) and the observed illuminated object. Of course, phases of different objects – including the Earth – can be seen from other bodies than the Earth.
Exoplanets: from detection to the first maps
During their orbit, exoplanets also show us different phases. The situation is similar to the one with Mercury or Venus, in which the exoplanet plays the role of the inferior planet and the star that of the Sun.
Practically, exoplanet can generally not be directly observed, and even for the few that can, we do not resolve their surface yet, so we cannot directly see the phases of these objects. Nonetheless, whether we separate the planet from its star or not, there is anyway a variation of luminosity induced by the change of phase of the planet, as for the Moon or Venus. It is not yet possible to detect this variation for all the exoplanets, but it has already been measured for several of them. An advantage of this technique is that we do not need the planet to transit (pass in front of) its star.
Thanks to this method, astronomers have already been able to create the thermal map of some exoplanets. For the moment, these maps have a limited resolution, but this field of exploration is still young and there is no doubt that the technique will keep improving in the coming years. The first exoplanet that was mapped was the hot Jupiter HD 189733 b, in 2007 by Heather Knutson and collaborators, thanks to observations done with the Spitzer Space Telescope. Since then, this technique has been used for others exoplanets, such as the super-Earth 55 Cancri e. The study about this object was published by Brice-Olivier Demory (now a member of PlanetS) and collaborators in 2016. Even if these maps do not allow to see the “surface” of the planets very precisely yet, they still permit to already get some global information on these objects.
For example, on HD 189733 b, the temperature varies between 700 and 930 °C, that shows that the heat received from the star on the dayside is well redistributed on the nightside. Also, the hottest point of the planet does not face the star, but is shifted eastward by about 16 degrees, that shows that powerful winds are blowing, with an estimated speed of 10 000 kilometres per hour. In the case of 55 Cancri e, the temperature varies between 1100 and 2400 degrees, that shows that heat redistribution is much less efficient. Again, the hottest point is shifted eastwards, by about 40 degrees. One should notice that these maps are based on the assumption that the planet has a synchronous rotation, i.e. that its makes one turn on itself during each orbit and that it therefore always shows the same face to its star, as the Moon with the Earth. This assumption is justified by theoretical studies but remains difficult to observationally verify for the moment.
Adrien Coffinet
References :
Knutson et al., Nature 447, 183-186 (2007)
Demory et al., Nature 532, 207–209 (2016)

